This blog is an ongoing assignment for Gov 1347: Election Analytics, a course at Harvard College taught by Professor Ryan Enos. It will be updated weekly and culminate in a predictive model of the 2024 presidential election.
Introduction – Can we predict election outcomes using only the state of the economy? If so, how well?
In our previous blog, we established some fundamental understanding and visualizations regarding vote share and geographic distributions. Now, we begin examining how fundamental variables influence elections – namely, the economy. Political and data scientists have commented on the economy’s ability to influence elections and election forecasts. For example, if the economy were the experience modest growth, the equations predicted that the Republican candidate would likely win the election (Fair 2018). Additional research also showed that the state of the economy has a non-negligible ability to mobilize and persuade voters. (Sides and Vavreck 2013).
All in all, the economy clearly has some impact on voter behavior and predicting election outcomes. How much or how little is a trickier question. Hopefully this blog will illuminate further aspects and allow us to improve our models down the road. Let’s take a closer look!
2020 Or Not?
One of the first measurements of economic growth and performance is quarterly GDP growth. Within this value reflects many important factors including consumer spending, business investment, and government activity, which are key indicators for economic health. Under an election-prediction lens, positive trends benefit incumbents as voters may credit them with economic stability and vice versa. I’ve created a bivariate regression below to examine the relationship between second quarter GDP growth and two-party vote share:
##
## Call:
## lm(formula = pv2p ~ GDP_growth_quarterly, data = d_inc_econ)
##
## Residuals:
##     Min      1Q  Median      3Q     Max
## -6.7666 -3.3847 -0.7697  2.9121  8.8809
##
## Coefficients:
##                      Estimate Std. Error t value Pr(>|t|)
## (Intercept)           51.2580     1.1399  44.968   <2e-16 ***
## GDP_growth_quarterly   0.2739     0.1380   1.985   0.0636 .
## ---
## Signif. codes:  0 '***' 0.001 '**' 0.01 '*' 0.05 '.' 0.1 ' ' 1
##
## Residual standard error: 4.834 on 17 degrees of freedom
##   (1 observation deleted due to missingness)
## Multiple R-squared:  0.1881,	Adjusted R-squared:  0.1403
## F-statistic: 3.938 on 1 and 17 DF,  p-value: 0.06358
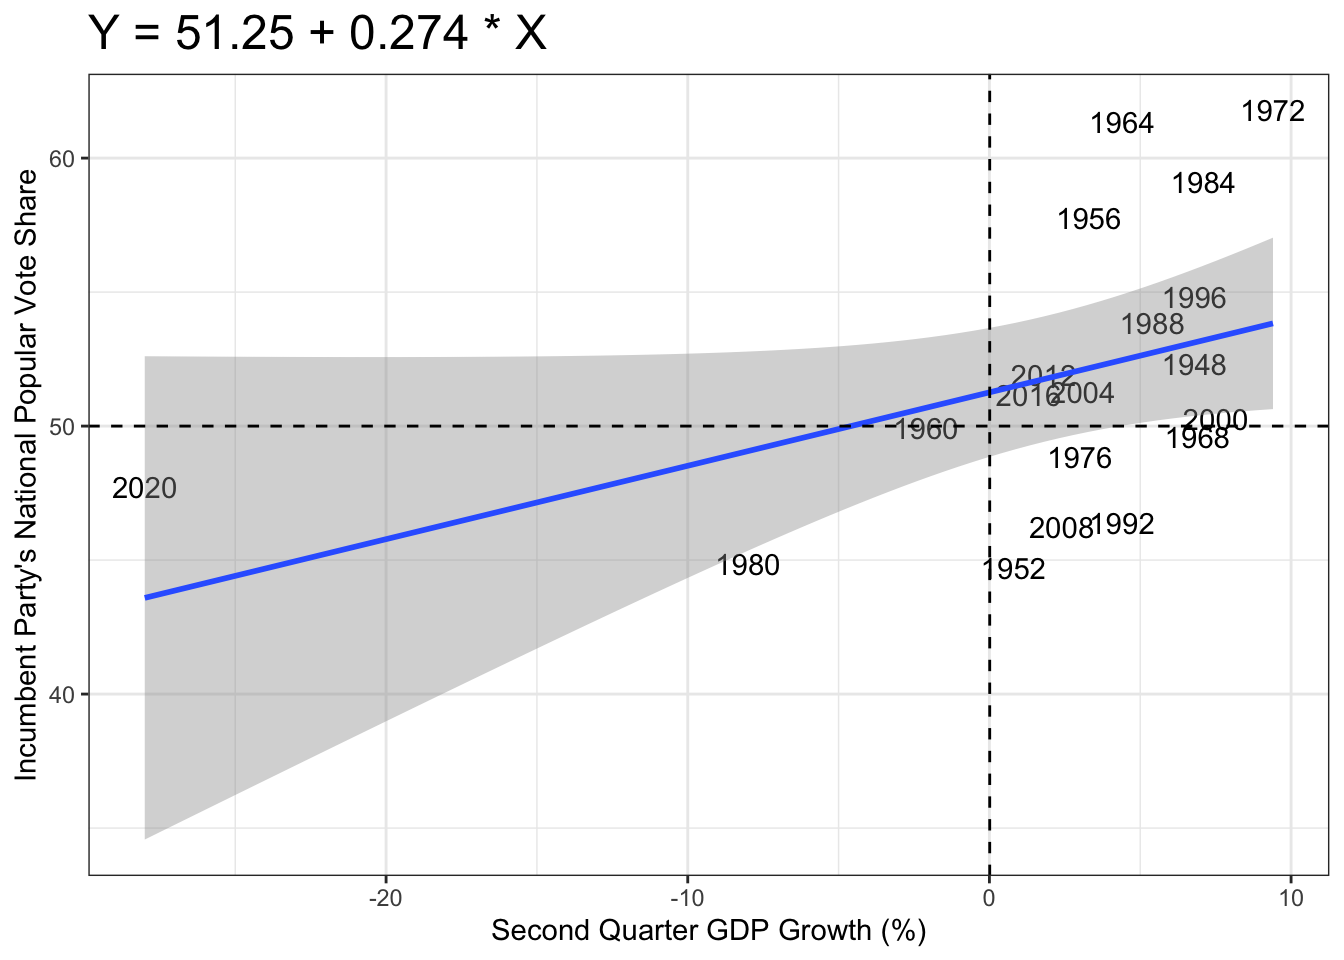
There are a few important things to notice. Overall, there seems to be some slight positive relationship between second-quarter GDP growth and the incumbent party’s share of the popular vote. Specifically, as GDP growth increases, the incumbent party tends to receive a higher vote share. However, the shading around the regression line reveals a fair amount of uncertainty in the prediction, especially for lower levels of GDP growth. From our summary statistics panel, we also see that the coefficient for GDP growth has a p-value of 0.0636, which is above the standard 0.05 threshold for statistical significance. This means there is some evidence of a relationship between GDP growth and vote share, but it’s not statistically significant, indicating that while economic conditions matter, there may be other factors at play. The low R-squared value of 0.1881 and high residual standard error of 4.834 suggest that economic performance alone is not powerful enough to capture elections and voter behavior.
We can also observe that 2020 represents a significant outlier, with a much lower vote share than the model predicts based on GDP growth alone. This is evidence that external factors, including public health crises like COVID-19 can play a major role in an election, even overriding the typical relationship we observe between economic performance and electoral success. It’s possible that many voters focused on how the incumbent handled the public health event, placing less emphaisis on other fundamental indicators like GDP.
Let’s take a look and see what our model would look like with 2020 removed:
##
## Call:
## lm(formula = pv2p ~ GDP_growth_quarterly, data = d_inc_econ_2)
##
## Residuals:
##    Min     1Q Median     3Q    Max
## -6.237 -4.160  0.450  1.904  8.728
##
## Coefficients:
##                      Estimate Std. Error t value Pr(>|t|)
## (Intercept)           49.3751     1.4163  34.862   <2e-16 ***
## GDP_growth_quarterly   0.7366     0.2655   2.774   0.0135 *
## ---
## Signif. codes:  0 '***' 0.001 '**' 0.01 '*' 0.05 '.' 0.1 ' ' 1
##
## Residual standard error: 4.463 on 16 degrees of freedom
##   (1 observation deleted due to missingness)
## Multiple R-squared:  0.3248,	Adjusted R-squared:  0.2826
## F-statistic: 7.697 on 1 and 16 DF,  p-value: 0.01354
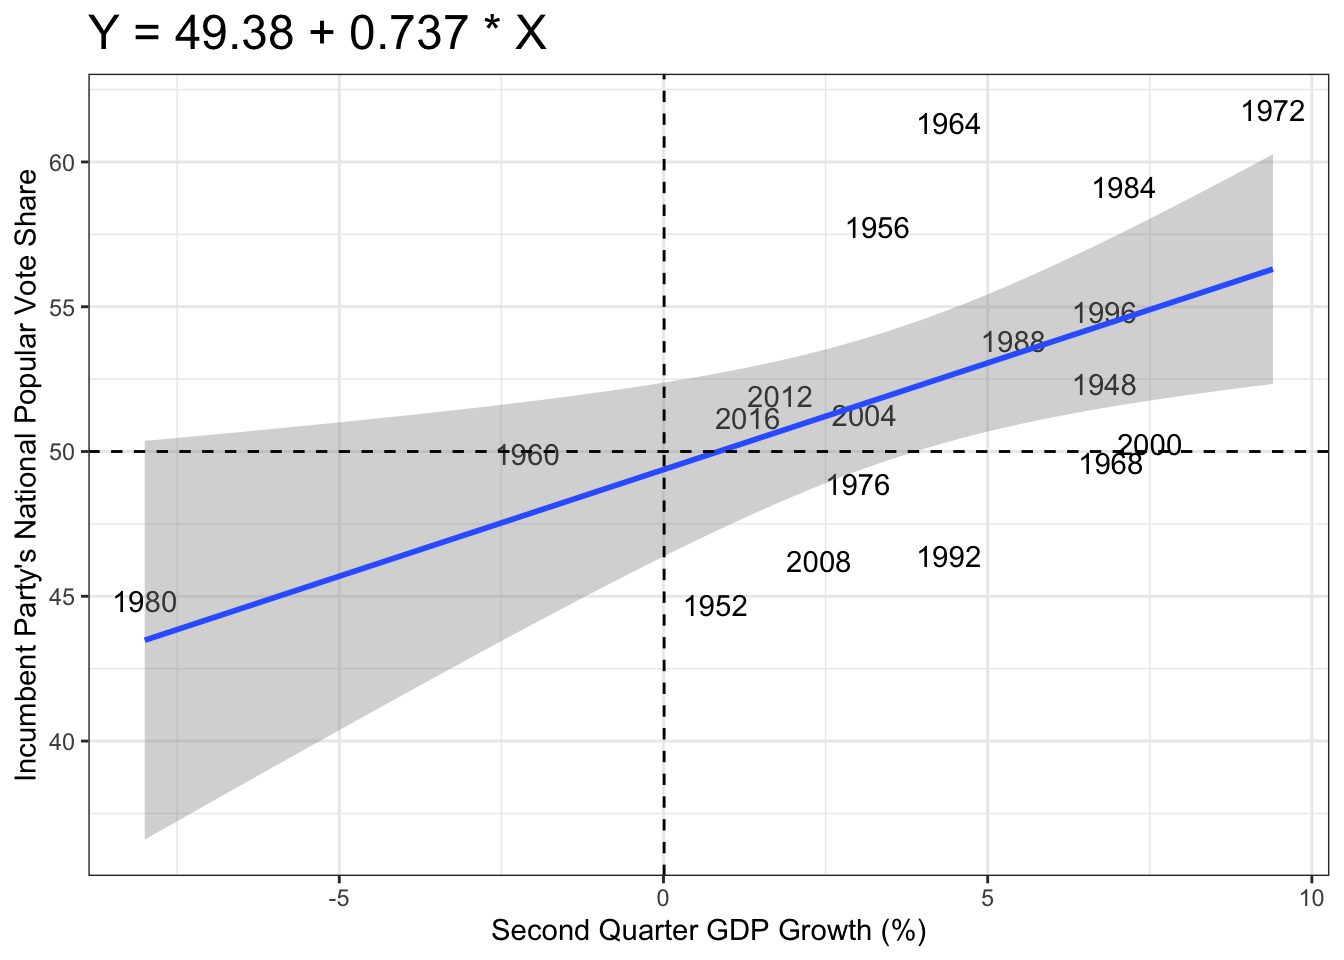
Besides the similar trends previously observed, with the 2020 data point removed, the R-squared value alone (0.3248) already shows us that the model fits the data better. The shading around the regression line is narrower, indicating a more consistent relationship between GDP growth and vote share. The p-value for GDP growth is now 0.0135, which is below the 0.05 threshold and therefore statistically significant. In general, we can see how much of an outlier 2020 was. Compared to before, it likely pulled down the slope and increased the uncertainty, as the incumbent party’s vote share was much lower than expected based on GDP growth.
A correlation calculation further supports the observations above. The first value is with 2020 and the second value is without.
Table: Table 1: Correlation between GDP Growth and Incumbent Vote Share
| Model | Correlation |
|---|---|
| With 2020 | NA |
| Without 2020 | NA |
GDP, DPI, and Both
As an extension to our models, let’s examine other economic factors and provide side-by-side comparisons of each to discover prediction outcomes and sensitivity robustness. For our purposes, we will use disposable personal income (DPI) as our independent variable. Similar to GDP, research has found that voters who experience a rise in disposable income are more likely to support the incumbent, whereas those experiencing a decline might vote for the opposition (Healy 2017). As DPI increases, voters may feel more economically secure, which can result in greater support for the incumbent party. However, nuances and changes related to income inequality can play significant roles in how voters perceive DPI and their voting behavior as candidates explore redistribution initiatives (Zivkovic 2021).
To investigate this further, I created 3 models based on 3 different factors – GDP, DPI, and GDP + DPI. Below we can see a comparison between their R-squared values, AIC (Akaike Information Criterion), and BIC (Bayesian Information Criterion).
## # A tibble: 3 × 5
##   model           r.squared adj.r.squared   AIC   BIC
##   <chr>               <dbl>         <dbl> <dbl> <dbl>
## 1 GDP Model          0.188        0.140    118.  121.
## 2 DPI Model          0.0638       0.00875  120.  123.
## 3 GDP + DPI Model    0.193        0.0922   120.  123.
At first glance, we can see that the the addition of DPI to GDP does not greatly increase the R-squared value (increased from 0.1881 to 0.1930), which is possibly due to multi-co linearity, in which GDP and DPI are both highly related to one another and can be seen as redundant. However, when DPI was used on its own, we see a sharp drop in the R-squared value, indicating that DPI does not provide a strong explanation for voter behavior and election outcomes. Of course, we have to keep in mind that this is with the 2020 data point included, which we’ve already observed to have weakening impact on our models from before.
Now that we have 3 models, we can predict the vote share for 2024 and compare them side-by-side:
Table: Table 2: Predicted Vote Share for 2024 based on Different Models
| Model | Predicted_Vote_Share |
|---|---|
| GDP Model | 52.07966 |
| DPI Model | 51.98460 |
| GDP + DPI Model | 52.11903 |
Unsurprisingly, there is little difference between the three models on their predictions, with the DPI-only model predicting the lowest vote share. More importantly, let’s test each model’s sensitivity to changes in measurement for GDP, DPI, and the economy as a whole. First, let’s do a cross-validation test, in which we hold hold out some years and train the model on the remaining data:
## Out-of-sample error for GDP Model: -1.443742
## Out-of-sample error for DPI Model: -1.458842
## Out-of-sample error for GDP + DPI Model: -1.242682
The model has similar out-of-sample errors for GDP and DPI, which indicates that both provide roughly comparable predictive power for our data. The best seems to be the combination of GDP + DPI, which while not perfect, suggest that the models are reasonably good at predicting election outcomes based on our economic data.
We can also visualize each model’s performance below based on changes in economic measures to see how sensitive it is:
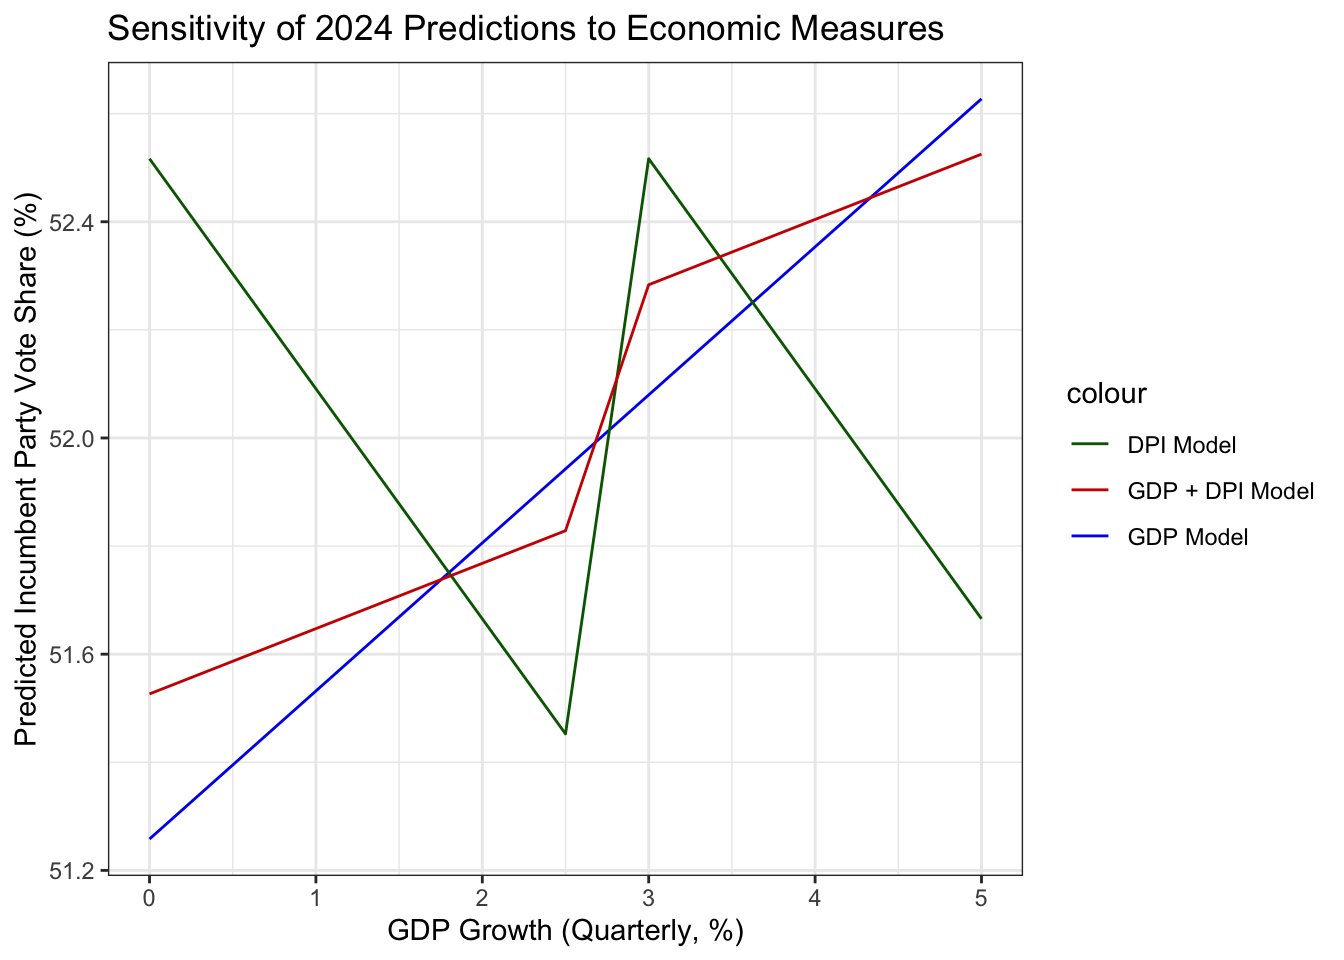
Both red (GDP + DPI) and blue (GDP only) show relative stability in their predictions and a reasonable increase in incumbent party vote share with each respective increase in quarterly GDP growth. However, we can see that the DPI-only model struggles significantly to produce a meaningful prediction as economic measures change. This makes logical sense as we consider the extremely low R-squared value we previously found.
Now What?
Overall, we’ve understood how fundamental economic factors influence election outcomes and voter behavior. Literature has shown a relationship between the two, highlight how strong economic performance tends to favor the party in power, while economic downturns can jeopardize their chances. However, this relationship isn’t an end-all-be-all as our data and models show relatively low correlation and R-squared values. Further, economic factors like DPI seemed to perform worse compared to standard models at fitting and predicting future election outcomes. All in all, this exploration has showed that the economy does have some influence on voter behavior and excites me to add additional non-economic variables to improve my model, such as demographic data, media/advertising, and policy initiatives.
Also, with 2020 being such an outlier, is it even worth keeping in our models…? Stay tuned!
Data Sources:
Data are from the GOV 1347 course materials. All files can be found here. All external sources are hyperlinked.